In the decade from October 1990 until March 2000, Nasdaq Composite Index with its focus on technology companies increased by 1 444 per cent – or, approximately 34 per cent annually – measured in USD. The last part of this rise was particularly strong; in 1998 the index increased by 40 per cent and in 1999 by 86 per cent. The year 2000 kicked off strongly too, with an increase of 24 per cent prior to the index reaching the high in March of the same year, whereby it decreased by 78 per cent until October 2002. An investor that invested in the index on January 1st 1998, experienced firstly that the value of the investment tripled in value. However, by the end of 2002, she was left with a negative return.
Looking back, we know this period from 1998 to 2002 to be the rise and eventual collapse of the dot-com bubble. A myriad of companies went bankrupt when the bubble burst, and these bankruptcies were especially concentrated among companies within internet services. These were in other words companies that delivered their services on a www domain that ended with .com, from which the name dot-com derives. Among the most famous companies we recall names like Pets.com and Webvan.com, but also big communication companies like Worldcom (a company also known for accounting fraud), NorthPoint Communications and Global Crossing. In common, these two groups suffered from huge operational losses, but had an exaggerated belief in growth in the foreseeable future coupled with aggressive investments to fuel its growth ambitions.
At the peak of this euphoria, the Nasdaq Composite Index was traded at more than 200 times expected earnings.
Differences between the two periods
We are in the eleventh year of growth in global equity markets since the financial crisis. The rise has been led forth by the technology sector. Many investors ask themselves, for this very reason, if we experience today a new dot-com bubble. Our view is that even though technology shares have performed strongly for many years, there are few parallels between the current market environment and the dot-com bubble environment.
If we look at the development of the Nasdaq Composite since the low point in March 2009, the index has grown by a little more than 20 per cent annually, compared to the annual 34 per cent increase until the peak of the dot-com period. In other words, value increase has not been similarly strong. More importantly, the index performance is supported by a steady profitable income growth for the sector. The companies are also immensely well capitalized throughout this period, and the technology sector has, for instance, net cash balances, whereas most of the other sectors have net debt. In addition, the companies have very solid and consistent cash flows. The five largest companies in the S&P500 Index, Amazon, Alphabet (Google), Apple, Facebook and Microsoft, account for 22 per cent of the index, but also generate 22 per cent of the cash flow.
Consequently, we do not recognize these as bubble tendencies comparable to those of the dot-com period.
Stock based compensation is also a cost
DNB’s technology funds invests in companies within the global technology, media and telecoms sectors. To capture the global Tech universe, we use an index compiled of the market weights of MSCI World Information Technology and MSCI World Communications. This index is now traded at 25 times the expected earnings for the coming twelve months. Even though this is more expensive than the average during the last ten years at 16 times the expected earnings, the higher valuation is founded in strong growth prospects and a low interest rate environment. We do not consider the 25 times expected earnings for Tech to be expensive, compared to the MSCI World Index being traded at 21 times the expected earnings. We think that Tech has stronger growth prospects than the World index, because the companies in the sector eat into traditional industries. Tech companies have contributed heavily to maintain the world economy after the Covid-19 outbreak, and the growth prospects have been strengthened for many companies in the aftermath of this.
Thus, even though market performance has been strong and company valuations have increased we do not see any visible signs that suggest the rise of a new bubble within the Tech sector.
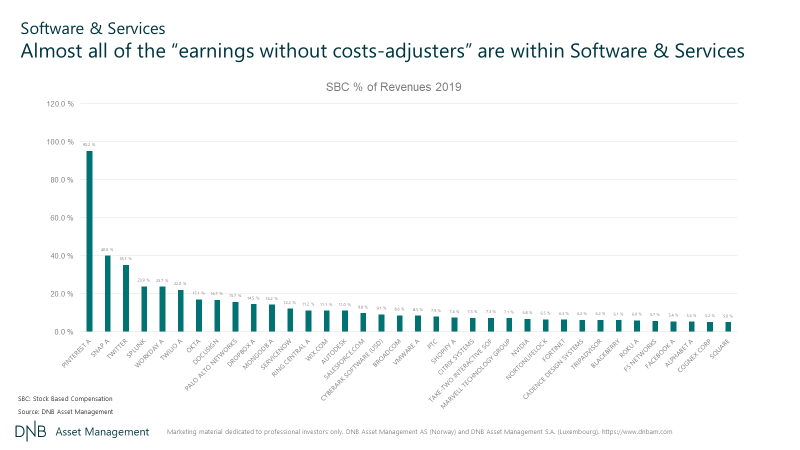
We do, however, see market segments in which there are signs of euphoric conditions. One of these segments is Software & Services. Said group accounts for approximately 100 companies and 37 per cent of DNB’s technology strategy’s reference index. 20 of these companies are operating with negative operational results, while 32 have insignificant earnings compared to their market value. In other words, half of the sub-sector valuation is based on optimistic assumptions regarding future earnings. The sub-sector is valued at 35 times its earnings, and this is before inclusion of management stock option programs, which many investors tend to exclude from their earnings estimates. This is because they consider options to be a temporary remuneration in a growth phase. We do not share this vision. Looking back at the past ten years, option costs as part of sales have not been reduced, and if one was to remove this part of the remuneration it is fair to assume that the targeted employees would consider it a wage cut and switch employers. When including the option cost in the earnings estimate, many companies change from expensive to highly overvalued.

Changes create opportunities
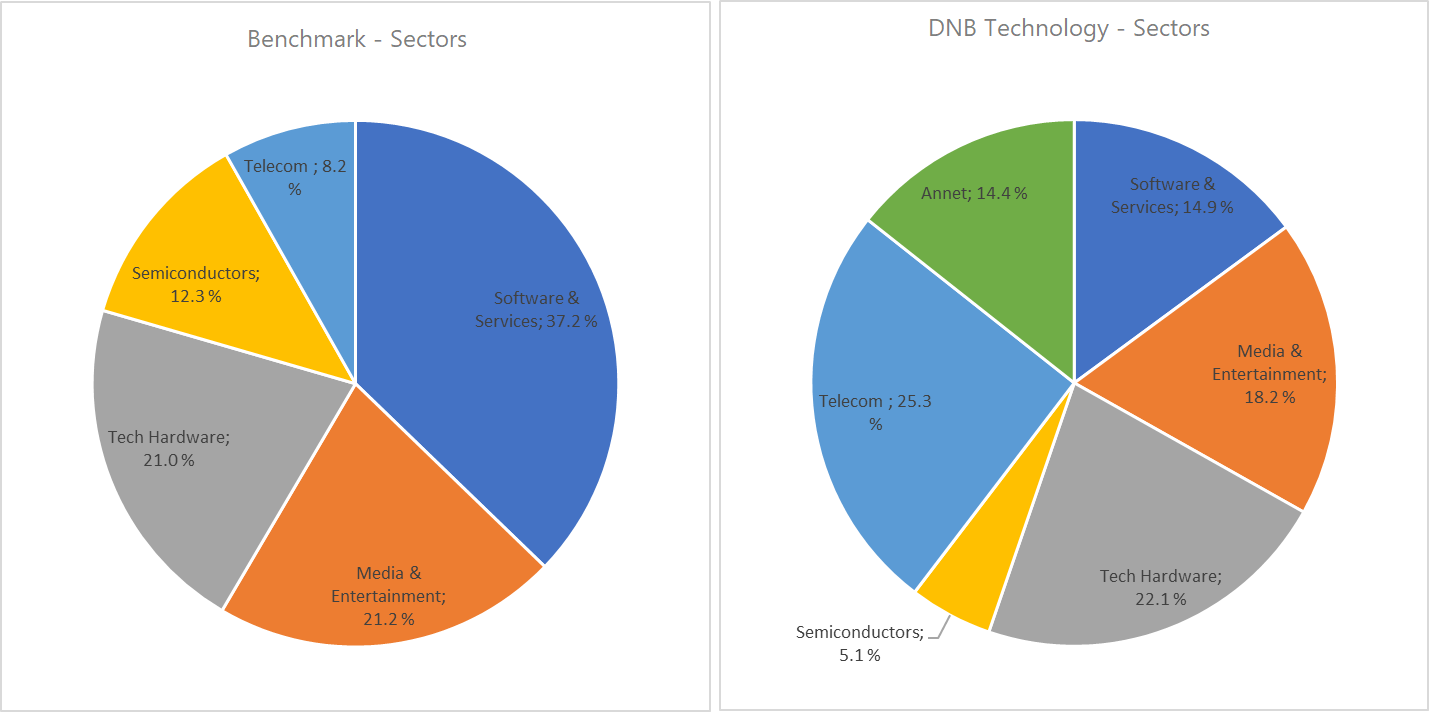
DNB’s technology strategy has gradually lowered its exposure in Software & Services. Today the sub-sector account for 15 per cent of portfolio holdings divided between four companies; Microsoft, Oracle, Capgemini and SAP. Due to this, we have in the short term lagged the reference index, since performance in Software & Services has been strong in both 2019 and this year. Over time, we believe however that other companies will deliver higher returns than companies in said group. And we recall the investor in Nasdaq Composite in 1998 that, despite tripling during the first two years, was left with a negative return after four years.
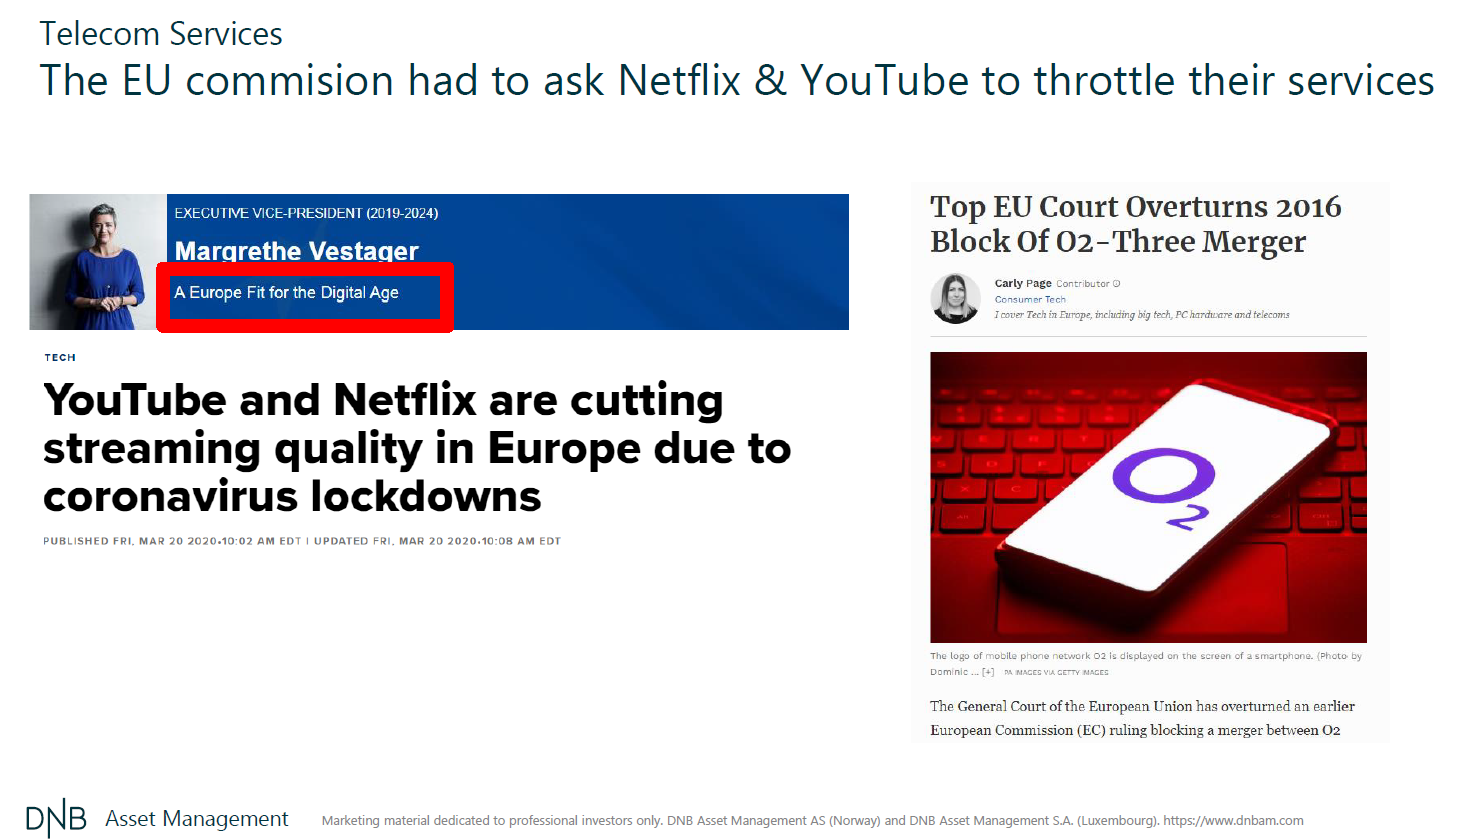
At the same time as we have reduced the exposure in Software & Services, we have increased the exposure in the Telecoms sub-sector. Telecoms, which accounts for eight per cent of the reference index, has been left in the shadows of the broader Tech market the last ten years and has barely delivered returns to investors. We believe this is about to change. The problem with the telecoms market has been strict regulation that in most western markets has required four companies to build networks and compete for customers. In a market structure like this, the price competition becomes too irrational and the networks become too poorly utilized, resulting in low return on capital. This situation is about to change as a result of the next generation’s mobile network, 5G. In the US, the regulators have approved a merger between company number 3 and 4 in the market, T-Mobile and Sprint, so that one get a 3-player market. The reasoning for the approval of such a merger has been to increase the return on capital in the sub-sector, which again will stimulate companies to invest in improved networks and 5G. We think that similar mergers will take place in Europe, especially after the Covid-19 virus has been an eye-opener for regulators of the weaknesses in existing networks. Any improvement of today’s market structure will be positive for shares in a sector that, despite healthy financials, trades only at 13 times expected future earnings.

As active investment managers, our job is to deliver excess return compared to index over time. We do this by positioning the fund differently than composition of the index. Timing the differences within sub-sectors is not where our strengths lie. Instead, we focus on implementing sub-sector tilts gradually and make sure that the odds of company valuations work in our favour. Now the largest differences in the portfolio compared to benchmark are the 17 per cent overweight in Telecoms and 22 per cent underweight in Software & Services. This difference has contributed to about half (6.5 percentage points) of the strategy’s underperformance against the reference index since the beginning of 2019. However, we believe that the current portfolio composition provides an important foundation for outperformance going forward.

Since the start of the strategy in 2001 we have focused on avoiding the most heated parts of the technology universe and, at the same time, positioning the portfolio towards similar trends as reasonably priced as possible. In the short term, this strategy exposes us to the fluctuations in the benchmark. On the other hand, in the long term, this lays the foundation for an excess fund performance relative to benchmark. The fund is today trading 17 times expected earning against 25 times for the reference index.
| DNB Fund Technology, Class A Retail Eur
Annual return, % 01.01.09 - 13.08.20 | |||
|---|---|---|---|
| Year | Fund | Index | Relative |
YTD | 6.13 | 12.58 | -6.45 |
| 2019 | 32.64 | 42.90 | -10.26 |
| 2018 | 5.04 | 0.56 | 4.48 |
| 2017 | 18.30 | 11.84 | 6.46 |
| 2016 | 17.80 | 13.27 | 4.53 |
| 2015 | 23.31 | 15.09 | 8.22 |
| 2014 | 21.04 | 26.81 | -5.77 |
| 2013 | 39.17 | 25.75 | 13.42 |
| 2012 | 6.27 | 12.52 | -6.25 |
| 2011 | 0.15 | 2.08 | -1.93 |
| 2010 | 29.88 | 22.60 | 7.28 |
| 2009 | 95.90 | 54.78 | 41.12 |
| Accumulated return, % | Fund | Index | Relative |
| 3 Years | 63.95 | 73.49 | -9.54 |
| 5 Years | 117.67 | 109.18 | 8.49 |
| Report period | 1059.07 | 719.70 | 339.37 |
| Annualized return, % | Fund | Index | Relative |
| 3 Years | 17.91 | 20.16 | -2.25 |
| 5 Years | 16.83 | 15.91 | 0.92 |
| Report period | 23.48 | 19.85 | 3.63 |
In this growth period, which started in 2009, the strategy has delivered an average of 3.6 per cent annual excess return after fund costs. We look at the performance of our Luxembourg domiciled technology fund, DNB Technology in this example. The results that have been achieved have not been free of risk, and the fund has been behind the index 5 out of 12 years if 2020 is included.
Disclaimer: Nothing contained on this website constitutes investment advice, or other advice, nor is anything on this website a recommendation to invest in our Funds, any security, or any other instrument. The funds mentioned may not be available in the markets you represent. The information on this blog is posted solely on the basis of sharing insight to make our readers capable of making their own investment decisions. Should you have any queries about the investment funds or markets referred to on this website, you should contact your financial adviser.
Last updated:


Share: