Fallen Angels: The last free lunch?
Fallen Angel bonds have outperformed high-yield peers with more than three percent per year. Is this the last free lunch in the financial markets?

Due to a structural divide between investment grade and high-yield investors, large market size differences and strict and rigid rules for downgrades, Fallen Angel bonds have outperformed high-yield peers with more than 3 percent per year.
None of the underlying drivers are expected to go away so this anomaly is expected to persist.
What is a Fallen Angel?
A bond downgraded from an investment grade rating (IG) to a high yield (HY) rating is often referred to as a fallen angel (FA). IG bonds are deemed highly unlikely to default and hold a BBB- rating or higher. High Yield bonds generally have a greater risk of default and are rated BB+ or below. Investment Grade bonds also tend to have longer duration, lower coupons and weaker covenants due to more solid fundamentals.
Since IG and HY investments have different characteristics, there is a clear and structural divide between IG and HY investors and many IG investors are sellers of FAs. Rating changes are one of the most common reasons why index members’ change and FA bonds are excluded from an IG index at its next monthly rebalancing. To avoid breaches with mandates and increased tracking error, IG investors have strong incentives or are even forced to sell FAs within a short time period, creating short term price pressure.
Historically Fallen Angels have outperformed other fixed income classes
Studies going back to 1991 show that Fallen Angels (FA) underperform Investment Grade peers by 15 percent in the downgrade month and the preceding year. They then outperform Investment Grade- and High Yield peers by 10 and 6 percent over the next two years respectively.
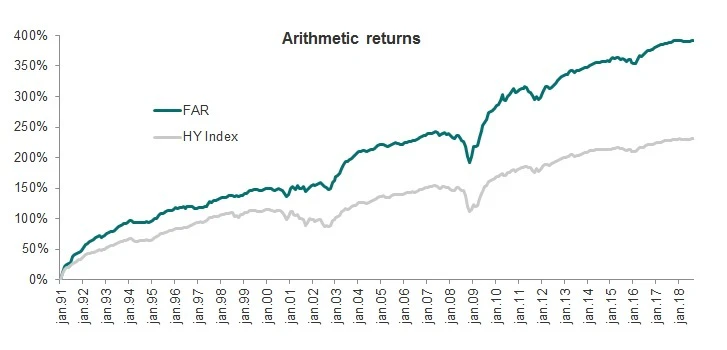
Since 1991 a naïve buy–all Fallen Angels strategy has had a 3 percent annualized outperformance over High Yield peers.
A slightly more advanced strategy, published by Ben Dor and Xu in 2011 [1], called Fallen Angels Reversal (FAR) has had a 6 percent annualized outperformance over HY peers. FAR stays away the first 3 months after the downgrade and adds a few additional risk management triggers. Volatility is higher but risk adjusted returns are better with a Sharpe ratio of 1.3 vs. 1.0 for HY peers.