

Published:
Betting on value stocks used to be the all-season bet that just worked. According to our analysis, it did in the 70’ies, 80’ies and 90’ies. The value payoff was spectacular in the years 2000 – 2005. At this point, the growth managers were threatened by extinction!
Academia picked up this factor early. It became one of the popular factors to include in systematic valuation models. Fama & French did an analysis in 1970ies that still is part of any finance “ABC” course at the universities today. It became one of the factors ‘everybody’ was using. Fama & French now focus on five factors: Value, Size, Risk, Profitability and Investment. I have always thought this model offers a terrible explanation to the performance of stocks, but let’s leave that for another article.
Value hasn’t really been working since 2008. This is not true for all countries, but for the US, it hasn’t been doing well enough to make alpha.
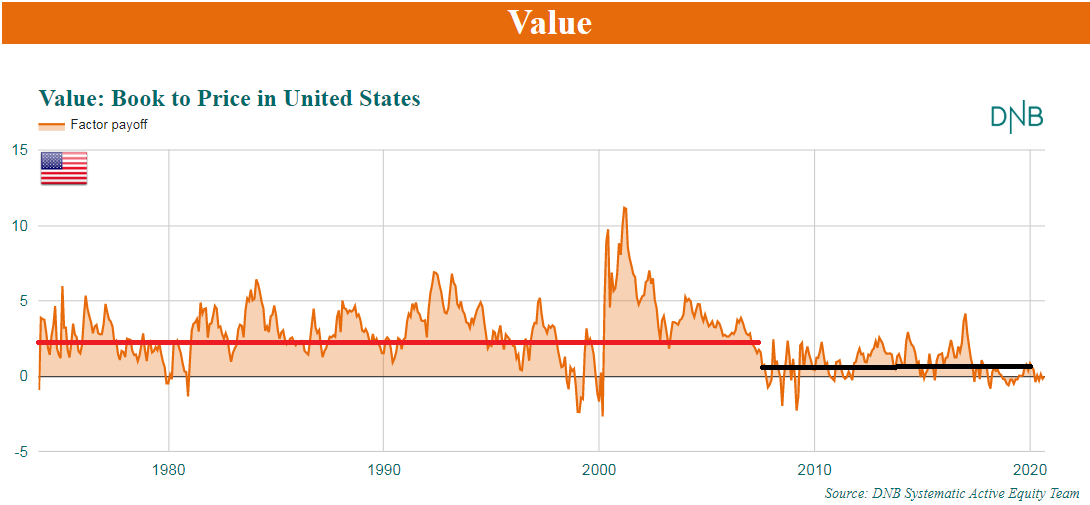
In DNB Systematic Active Equity Team, we use a multifactor model to find market preferences and find attractive stocks. We analyze more than 40.000 stocks in more than 40 markets to find factor payoffs and –trends. The graph above is our best attempt to illustrate the performance of the most known value factor. Most people use Price/Book, but since book values can be zero, this ratio is a little problematic in general analysis. We use the inverted version, Book/Price.
The payoff comes from a factor model with more than 60 factors. It tries to determine the payoffs, the market preferences that best explain monthly returns in the US. It is what analysts call a cross-sectional model. The average payoff to this factor from 1970 – 2008 is 2.2. The average since 2008 is 0.7. We have this graph for more than 40 markets, but the US market dominates most global portfolios.
Roughly one-third of the value performance is left. In my experience, this is not enough to create alpha at all. What makes it even more challenging to make alpha of this is that the value game is popular. Most portfolio managers are trying to make money on the value-game. It is a very competitive game!
Some of you already disagree with this graph because we all know that “value stocks” have been failing BIG, and this graph is hovering around zero. Most people expect it to be “very negative”.
And you are right. This is where something is rotten in the value/growth discussion. Let’s keep that graph in mind, and look at another type of analysis.
Quintiles
Regression models and payoffs are somewhat hard to explain and understand. Most managers, me included, often use deciles or quintiles to illustrate the performance of styles or factors. To do a quintile analysis, I would rank some stock universe on a factor (Book/Price), and then monitor the performance of five groups, quintiles.
Quintile 1 has the lowest-ranked stocks (least value exposure), and Quintile 5 with the stocks with the highest Book/price (value) exposure. If we do this on the MSCI US stock index universe this year, the numbers look like this:
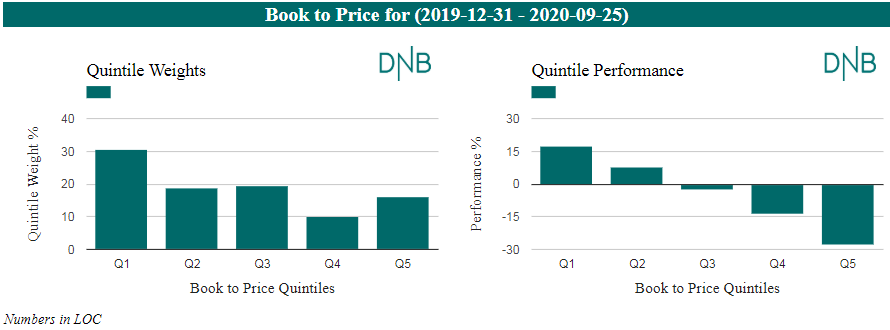
Performance of the quintiles is the bar-graph to the right. Take a look! The performance spread is 45 percentage points! Low-value stocks have a return of 17 % year to date, while high-value stocks have fallen 28 %. This spread is all over the “Value/Growth” discussion, and it looks outrageous. If you trust this kind of analysis, you would probably expect this to snap back at some point.
The main problem with the quintile analysis is that it doesn’t necessarily show the performance of “Value”. This factor, the “Book/Price” measure, is highly correlated with a lot of other measures. Like risk, the financial sector, debt/equity ratio and profitability.
Markets that are driven by risk preferences will contaminate the above analysis. The best example of such errors is another “Fama & French finding”. The performance of small-cap stocks. This is one of the most accepted factor premiums. It is generally accepted that small-cap stocks outperform large-cap stocks over time.
You would find such things if you did a quintile- or decile analysis over long periods of time. But if you run a cross-sectional regression with lots of factors, you would find the opposite.
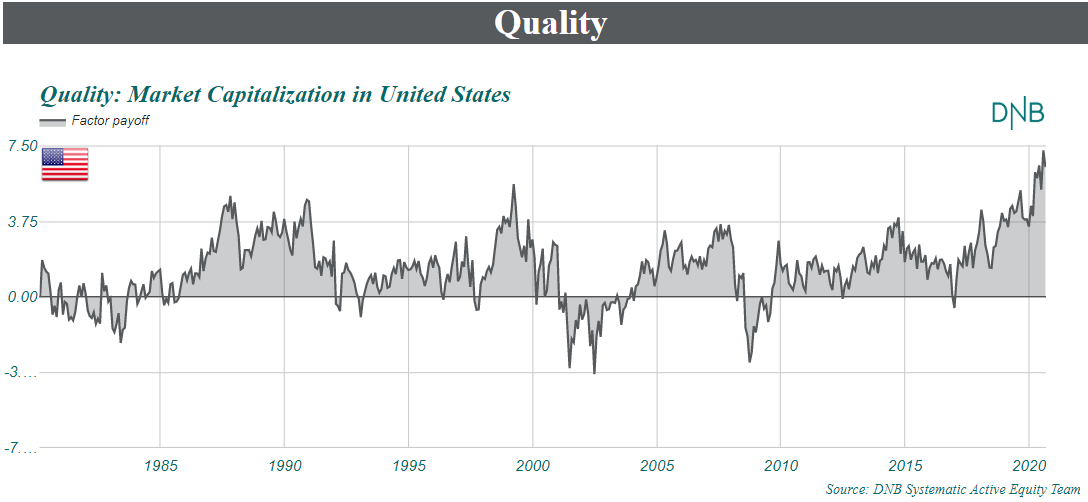
We use a large number of factors because we want to find the ‘pure’ payoff to each factor, not the contaminated returns from simple ranking exercises. The graph below shows the performance of size if we take risk, leverage, debt, profitability, momentum and growth-effects out of the picture. The purest performance of size we can find shows a very persistent large-cap bias. The opposite of the general view. It means that ‘all other things being equal’, investors prefer a large-cap stock over a small-cap stock.
It has always been like this.
I think Fama & French did something like “finding a negative relation between hair-length and weight” because they didn’t take gender into the equation. Men are on average much heavier than women, and this would contaminate the “hair length vs weight” analysis.
I think we have to stop looking at analyses that have this flaw. I think people should update their toolboxes, textbooks should be re-written, and the results from early finance should be lectured in history lessons instead of in modern finance courses.
When the facts change, I change my mind - what do you do, sir
Facts didn’t even change. If your analysis is too simplistic, you don’t find facts. If equity markets could be explained by simple models that don’t take correlated characteristics into account, creating alpha would not be such a difficult game.
I know that the value underperformance is contaminated by risk and leverage. It is also contaminated by the performance of profitability factors and sector momentums. It is time to throw the value/growth discussion overboard.
Equity markets are too complex for simple, short and catchy explanations. The analysis toolboxes have been upgraded, so this should be common knowledge today. Textbooks should be updated too.
Last updated:
Share: